
Blog
Auction trends in 2026: What PE and distressed asset managers need to know

TL;DR:
- Auction markets in 2026 are normalizing with volumes approaching pre-pandemic levels, signaling steady supply rather than crises. Buyers are willing to pay around 67% of estimated value, with demand normalized and sentiment cautiously bearish, influencing reserve pricing strategies. Timely auction execution and strategic reserve adjustments are essential for maximizing distressed asset recoveries in this environment.
The widespread assumption that distressed auction markets offer deep, crisis-level discounts is not supported by current data, and that gap between expectation and reality is costing portfolios real money. Auction trends in 2026 show a market that has normalized meaningfully since the pandemic-era disruption, with foreclosure volumes rising but still tracking below 2020 baselines, buyer price demand firmer than many underwriting models assume, and execution timelines that are measurable enough to anchor cash-flow planning. This guide breaks down the volume data, pricing dynamics, buyer sentiment, clearance rate signals, and process efficiency metrics that financial decision-makers need to build accurate recovery models.
Table of Contents
- Auction trends in 2026: Reading market normalization correctly
- Buyer price demand and valuation dynamics at auctions
- Auction buyer sentiment and pricing outlook
- Regional clearance rate variations and implications for bid strategy
- Auction process efficiency and impact on portfolio strategy
- Rethinking auction strategies: A practical perspective for 2026
- How Maas supports optimized auction strategies for distressed asset recovery
- Frequently asked questions
Key Takeaways
| Point | Details |
|---|---|
| Auction volumes normalize | Distressed auction volumes in 2026 approach pre-pandemic levels, signaling steady supply flows rather than crisis spikes. |
| Moderate auction discounts | Buyers pay around 67% of estimated resale values, indicating that discounts are moderate, not extreme. |
| Bearish but active buyers | Auction buyers expect price declines but maintain active portfolios and cautious bid strategies. |
| Clearance rates signal pricing gaps | Falling auction clearance rates often reflect seller reserve-price misalignment more than demand drops. |
| Execution timing matters | Auction listing-to-close timelines provide a realistic liquidity forecast vital for cash flow and rotation planning. |
Auction trends in 2026: Reading market normalization correctly
The single most important number to understand entering Q2 2026 is this: foreclosure auctions reached 66% of Q1 2020 volume, rising 33% year-over-year. That is not a distress signal. It is the most accurate description of where supply actually sits.
The framing matters enormously for deal pipeline timing. A 33% year-over-year rise sounds dramatic until you place it against the pre-pandemic baseline and recognize that REO auction volumes are approaching those same levels through gradual, systemwide normalization. There is no inventory spike, no sudden oversupply, and no late-cycle acceleration of the kind that might justify aggressive discounting assumptions.
For private equity and distressed asset managers, this normalization creates a predictable pipeline rather than an opportunistic flood. Deal sourcing must be precise and metro-level. Regional variation in supply is significant enough that a national average tells you little about a specific submarket. The table below illustrates how 2026 auction volumes compare to prior benchmarks.
| Auction category | Q1 2020 benchmark | Q1 2026 volume | Year-over-year change |
|---|---|---|---|
| Foreclosure auctions | 100% baseline | ~66% of baseline | +33% |
| REO auctions | 100% baseline | Approaching baseline | Steady recovery |
| Overall distressed supply | Peak pre-pandemic | Normalizing | Gradual, systemwide |
Key implications for deal pipeline planning:
- Expect gradual volume growth, not a sudden wave of distressed inventory that would erode pricing
- Prioritize metro-level sourcing over national-average analysis, since regional variation is material
- Model pipeline timing around steady normalization rather than cyclical spikes
- Avoid crowding carry-cost assumptions with volume projections that are unlikely to materialize at scale
Pro Tip: When building 12-month acquisition pipelines, index your volume projections to the Q1 2020 baseline rather than year-over-year growth rates. A 33% YoY increase from a deeply suppressed base still lands well below pre-pandemic levels, and treating it otherwise will inflate pipeline expectations. You can review additional context on execution approach in our overview of real estate auctions for industrial assets.
With supply normalizing, the critical next variable is how willing buyers are to pay, and at what percentage of value they are actually transacting.
Buyer price demand and valuation dynamics at auctions
The data on buyer pricing is more favorable than most distressed asset underwriting models assume. Buyers paid approximately 67% of estimated resale value (ERV) at both foreclosure and REO auctions in early 2026. That is a moderate discount, not the 50-cents-on-the-dollar assumptions baked into older risk models.

ERV is the market’s estimate of a property’s value in stabilized condition. When buyers pay 67% of that figure at auction, they are pricing in renovation costs, carry costs, and execution risk, but they are not pricing in distress panic. Buyer price demand reached 94% of Q1 2020 levels at foreclosure auctions and 102% at REO auctions, confirming that pricing has normalized alongside volume. This has direct implications for loan loss reserve calculations and portfolio valuation models.
| Metric | Foreclosure auctions | REO auctions |
|---|---|---|
| Average buyer price as % of ERV | ~67% | ~67% |
| Price demand vs. Q1 2020 | 94% | 102% |
| Discount severity | Moderate | Moderate |
| Market condition | Normalized | Normalized |
For underwriting purposes, the following factors drive pricing variation below and above the 67% average:
- Asset condition and deferred maintenance remain the most significant price-reducing variable at auction
- Metro-level supply-demand balance affects clearance speed and competitive bidding intensity
- Asset type (single-family versus multifamily versus commercial) carries distinct pricing premiums
- Bidder pool depth, which is driven by platform marketing quality and outreach reach, moves realized prices measurably
The practical implication for auction machinery asset recovery and broader distressed liquidations is that bid-to-title recovery modeling should be built on realistic ERV percentages. Using a 50% recovery assumption when the market is clearing at 67% produces conservatism that misallocates capital and understates portfolio value. Granular underwriting by asset and metro is not a nicety at this point in the cycle. It is a requirement. Note that precision manufacturing market conditions provide useful parallel context for how industrial asset valuations behave in normalized supply environments.
Buyer pricing data provides the “what.” Buyer sentiment explains the “why” and points to where prices may move from here.
Auction buyer sentiment and pricing outlook
The 2026 buyer outlook is cautiously bearish, and that caution is shaping bidding behavior in ways that matter for reserve-price setting and auction timing. 43% of auction buyers expect local home prices to fall in 2026, while only 36% see current markets as overvalued. That is a notable gap: buyers expect softness without believing assets are fundamentally mispriced.
“31% of auction buyers expect rents to decline in 2026,” according to Auction.com’s Buyer Outlook Report, pointing to constrained revenue assumptions for buyers financing acquisitions through rental income.
This matters for how you interpret current bid levels. Buyers are already pricing anticipated rent and value softness into their offers. That means current ERV-based discounts of 67% may reflect not just transaction costs but also forward-looking revenue conservatism. The relevant insight for sellers and recovery modeling is that pushing reserves significantly above current market bid levels will produce clearance failures rather than higher recoveries.
Key sentiment characteristics shaping 2026 bidding trends:
- Bearish price outlook without overvaluation concerns points to cycle awareness, not fear
- Active bidder participation remains intact, with many buyers planning to increase acquisition volume in 2026
- Rent decline expectations compress revenue-based valuations and dampen aggressive bidding on income-producing assets
- Moderate sentiment, rather than extreme pessimism, suggests stable clearance rates absent external shocks
Pro Tip: For sellers managing distressed inventory, the current sentiment environment favors realistic reserve pricing over aspirational hold strategies. Buyers are active and capitalized, but they are underwriting conservatively. Meeting them at a realistic reserve level produces faster execution and comparable net recovery to extended private negotiations. Explore additional guidance on auction absentee bidding strategies for managing bid submissions in this type of market.
Understanding buyer sentiment provides context for auction clearance rates, but clearance rates themselves carry additional signals worth examining directly.
Regional clearance rate variations and implications for bid strategy
Clearance rates are one of the most informative, and most misread, metrics in auction markets. When rates fall, the default interpretation is weakening demand. The more accurate interpretation is usually a mismatch between seller reserve prices and where buyer appetite actually sits.
The UK London market provides a clear case study. Auction clearance rates in London dropped from 60% in March to 36% in April 2026, a sharp decline driven by widening gaps between seller reserves and buyer bids rather than any fundamental collapse in buyer interest. The distinction matters because the appropriate response to a reserve-price mismatch is tactical adjustment, not withdrawal from the market.
For private equity and distressed asset investors, clearance rate signals support the following actions:
- Treat falling clearance rates as a repricing signal, not a liquidity signal
- Review reserve-price discipline immediately when clearance rates drop across multiple rounds
- Expand bidder outreach between auction rounds to increase the depth of the buyer pool before re-listing
- Identify motivated sellers in low-clearance environments, since distressed sellers with time-sensitive obligations become more negotiable when assets fail to clear
A structured response to declining clearance rates should follow this sequence:
- Analyze whether the clearance decline is asset-specific or market-wide before adjusting strategy
- Review reserve levels against current comparable transaction data, not listing price benchmarks
- Increase marketing reach and bidder engagement ahead of the next auction round
- Reassess carry costs against the cost of a reserve reduction to determine the optimal recovery path
- Consider a phased reserve adjustment rather than a single large reduction to preserve negotiating position
Pro Tip: A clearance rate below 40% at the asset level over two consecutive rounds almost always indicates a reserve-to-market-bid gap rather than an unsellable asset. Reducing the reserve by 5-8% while simultaneously expanding bidder outreach tends to recover clearance rates faster than either action alone. For managing auction timelines in asset disposition, see how auctions speed up industrial asset disposition.
With clearance dynamics addressed, the remaining variable for portfolio timing is auction process efficiency itself.
Auction process efficiency and impact on portfolio strategy
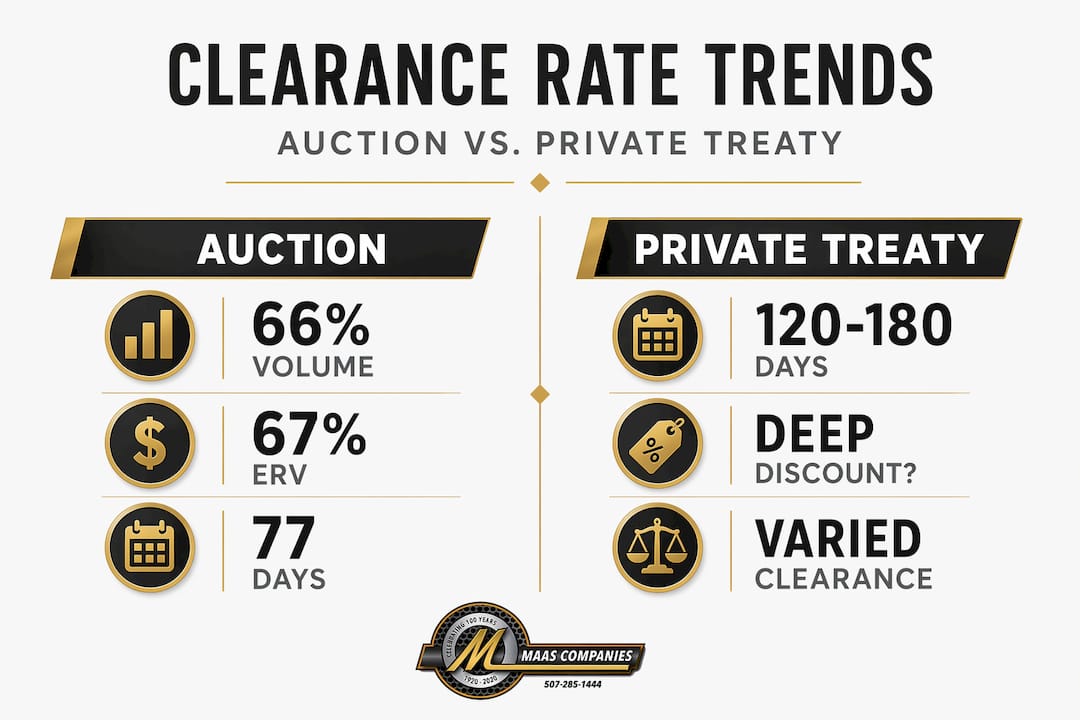
Execution speed is a quantifiable input for portfolio modeling, and 2026 is generating useful benchmarks. The Crexi platform reported a 173% year-over-year growth in auction transactions in Q1 2026 with an average listing-to-close time of 77 days. That 77-day figure is a liquidity clock you can build around.
For comparison, private treaty transactions in the same asset categories routinely extend to 120-180 days when factoring in negotiation, due diligence, financing contingencies, and closing delays. The auction format’s compressed timeline reduces carry costs materially and accelerates capital recycling.
| Disposition method | Average timeline | Carry cost exposure | Price certainty |
|---|---|---|---|
| Auction (Crexi Q1 2026) | 77 days | Lower | High (competitive bidding) |
| Private treaty sale | 120-180 days | Higher | Variable |
| Direct negotiation | 90-150 days | Moderate | Lower |
Key metrics that improve IRR and cash-on-cash return modeling:
- Bidder intensity on a given platform signals competitive price discovery potential and should be tracked per asset category
- Listing-to-close benchmarks by asset type give more accurate cash-flow forecasting than generalized hold-period assumptions
- Platform selection affects clearance speed and buyer pool depth, making it a strategic rather than administrative decision
Pro Tip: Build auction execution timelines directly into your IRR models as a variable input. A 77-day close versus a 150-day private sale may produce equivalent gross proceeds but materially different net returns once carrying costs, interest carry, and management overhead are factored in. Review planning considerations for government asset liquidation planning for additional context on execution timing.
Rethinking auction strategies: A practical perspective for 2026
The most common strategic error we observe in distressed auction underwriting is calibrating recovery expectations to crisis-period benchmarks that no longer reflect current market conditions. Investors who entered the market during 2008-2012 built intuitions around 40-55% of ERV recoveries. Those benchmarks do not apply to a normalized market where bid-to-title recovery modeling should be anchored around 67% of ERV.
The second error is treating clearance rate declines as demand failures rather than pricing signals. Reserve-price discipline shifts drive clearance rate volatility far more than buyer scarcity does. Investors who understand this recalibrate their reserve strategies and bidder outreach between rounds rather than abandoning the auction channel entirely.
A more productive framework for 2026 looks like this: treat auction data as a dynamic input rather than a static assumption. Buyer sentiment data, clearance rates, and platform execution benchmarks are updated quarterly, and the investors building the most accurate recovery models are the ones treating those updates as material inputs rather than background noise. The 94-102% pricing normalization relative to 2020 levels means that market timing calls based on anticipated deep discounts are likely to result in missed acquisitions rather than optimal entry points.
Practically speaking, maximizing auction lot value in this environment requires grouping assets strategically, setting realistic reserves grounded in current ERV data, and selecting platforms with demonstrated buyer pool depth in the relevant asset category. Understanding how brokerage and auction methods work together for complex industrial assets adds another layer of flexibility for investors managing diverse distressed portfolios.
The investors who will generate the strongest recoveries in 2026 are not the ones waiting for a crisis that may not arrive. They are the ones building execution-ready processes calibrated to the market as it actually is.
How Maas supports optimized auction strategies for distressed asset recovery
Executing on auction trends in 2026 requires more than data awareness. It requires an execution partner who can translate market insights into realized recoveries for complex industrial and commercial assets.

Maas Companies Inc. provides specialized auction and brokerage services for private equity firms and distressed asset managers handling industrial plants, equipment, real estate, and commercial properties. We integrate current market intelligence with aggressive, targeted marketing to shorten liquidation cycles and maximize bid-to-title recovery. Our approach is tailored to the asset, the market, and the investor’s timeline. You can review the full scope of capabilities in our services portfolio, or examine a completed industrial auction project to see how these principles translate into documented recovery outcomes. When your portfolio requires execution aligned with current 2026 bidding trends, Maas delivers the process and market reach to back it.
Frequently asked questions
How have auction volumes for distressed properties changed in 2026 compared to pre-pandemic levels?
Foreclosure auctions in Q1 2026 reached approximately 66% of Q1 2020 volume, reflecting systemwide normalization rather than a supply surge. REO auction volumes are recovering steadily on the same trajectory.
What level of discount should financial decision-makers expect when underwriting auctioned distressed assets in 2026?
Buyers paid roughly 67% of ERV at both foreclosure and REO auctions in early 2026, indicating moderate rather than deep discounts. Underwriting models that assume crisis-period recoveries of 40-50% will systematically undervalue current portfolio positions.
How does auction buyer sentiment affect pricing and bidding strategies in 2026?
With 43% of buyers expecting price declines and 31% anticipating rent softness, conservative revenue assumptions are already embedded in current bid levels. Sellers should align reserve pricing with this reality rather than holding for recovery that buyer pricing does not support.
What does a decline in auction clearance rates indicate for distressed asset investors?
Declining clearance rates, as seen in the London market’s April 2026 drop to 36%, typically reflect a reserve-to-bid-level gap rather than fundamental buyer withdrawal. The appropriate response is reserve recalibration and expanded bidder outreach, not channel abandonment.
Why is auction process timing important for portfolio optimization?
Crexi’s 77-day average listing-to-close time in Q1 2026 provides a concrete liquidity timeline that supports cash-flow modeling and capital rotation planning more accurately than private treaty alternatives, which routinely run 120-180 days.
Recommended
- How to Navigate Commercial Property Foreclosure Sales | Blog | Insights on Asset Liquidation and Auction Trends
- How Auctions Help Speed Up Industrial Asset Disposition | Blog | Insights on Asset Liquidation and Auction Trends
- Auction strategies for small businesses: Maximize asset recovery | Blog | Insights on Asset Liquidation and Auction Trends
- Auction absentee bidding: strategies for industrial equipment | Blog | Insights on Asset Liquidation and Auction Trends